What is a stocks expected move?
Wouldn’t it be great to know how far a stock would move over the next week or month? Well, by looking at the options chain you can. Sort of.
What is expected move?
Expected move defines the current expectations of the options market for the range of an underlying over the life of the option. At a particular instance in time this is the standard deviation of the expected move. In other words the options market expects that the price has a 68% chance of being +/- the expected move by options expiration.
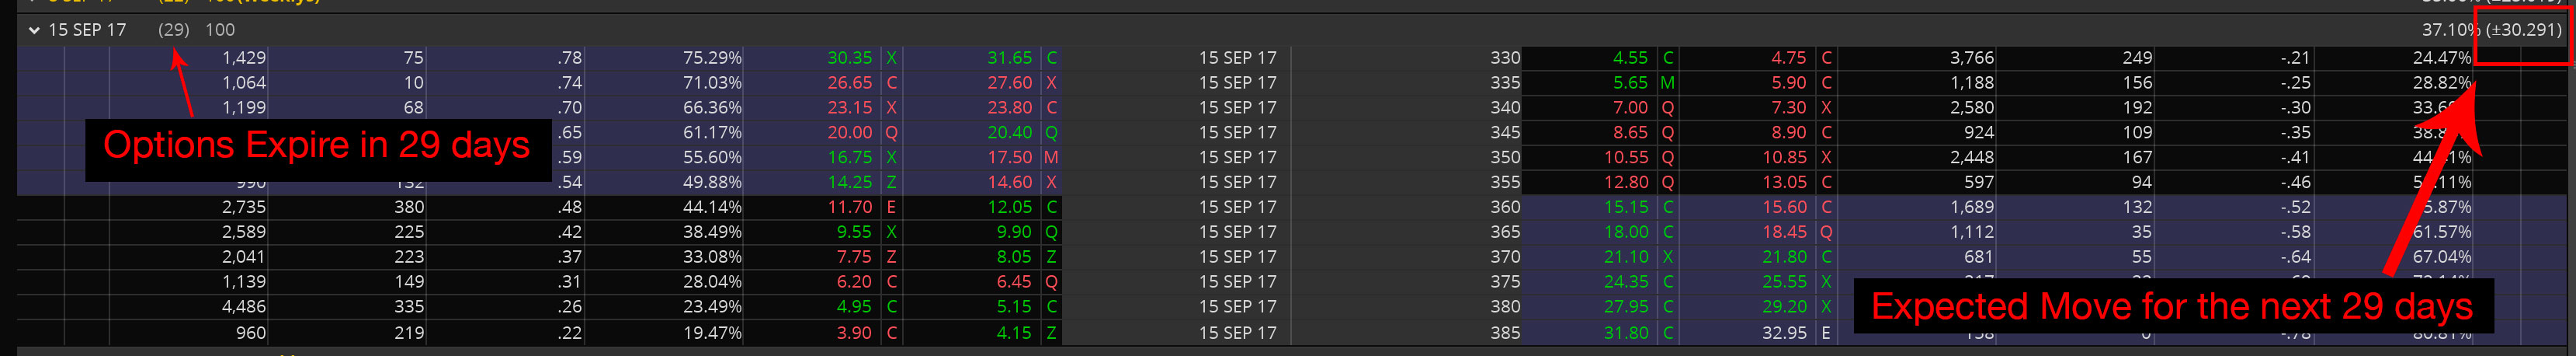
For example, say that the TSLA September 2017 monthly options with 29 days left to expiration are currently showing an expected move of 30.29. Tesla’s stock price is currently 356.73. This means that the options market currently expects that TSLA has a 68% chance of trading in the range from 387.02 to 326.44. Pretty cool right? Now what this doesn’t do is predict a direction or an exact price for TSLA of that period of time… nothing can. However, this is incredibly useful information.
How can you use it?
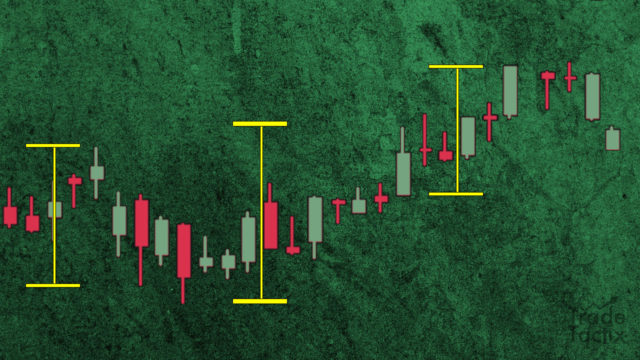
One great way to use expected move is to set realistic price targets for a stock. A stock may be in a monster bull move and you have high expectations for making a profit. How far should you let it run before taking profits? Or maybe you are seeing some major support or resistance zones in a stocks price. How likely is it that a stock can reach or break through those zones? Expected move can help with all of these analysis by framing price action into a probabilistic frame of reference.
Expected move is also great for setting price expectations for different time frames. How far is a stock likely to move over the next week? The next month? Or the next 6 months? Have a look at the expected move for those option chains.
How do you find it?
This expected move thing sounds pretty great, how do you find it? The expected move is defined by a stocks option chain. There is also a different expected move for the different option expirations so you can use it over varying time frames. There are two primary ways to find expected move.
The first is through your broker platform. With ThinkOrSwim the expected move is defined right on each option chain. Just have a look to the far right of each chain and it is there. ThinkOrSwim uses a complex mathematical calculation that takes into account many different factors and is considered to be pretty accurate. It’s updated continuously based on current market conditions and option prices.
If your broker platform doesn’t show expected move on from the option chains never fear because you can still find it directly from the option chain. The expected move is also called the At-The-Money straddle. In order to find it you can simply add together the price of the ATM Call option and the ATM Put option. In our TSLA example, the ATM Call is going for 14.60 and the ATM Put is going for 13.05. Adding these two together gives us 27.65. So the option chain is showing an expected move in TSLA of 27.65 over the next 29 days.
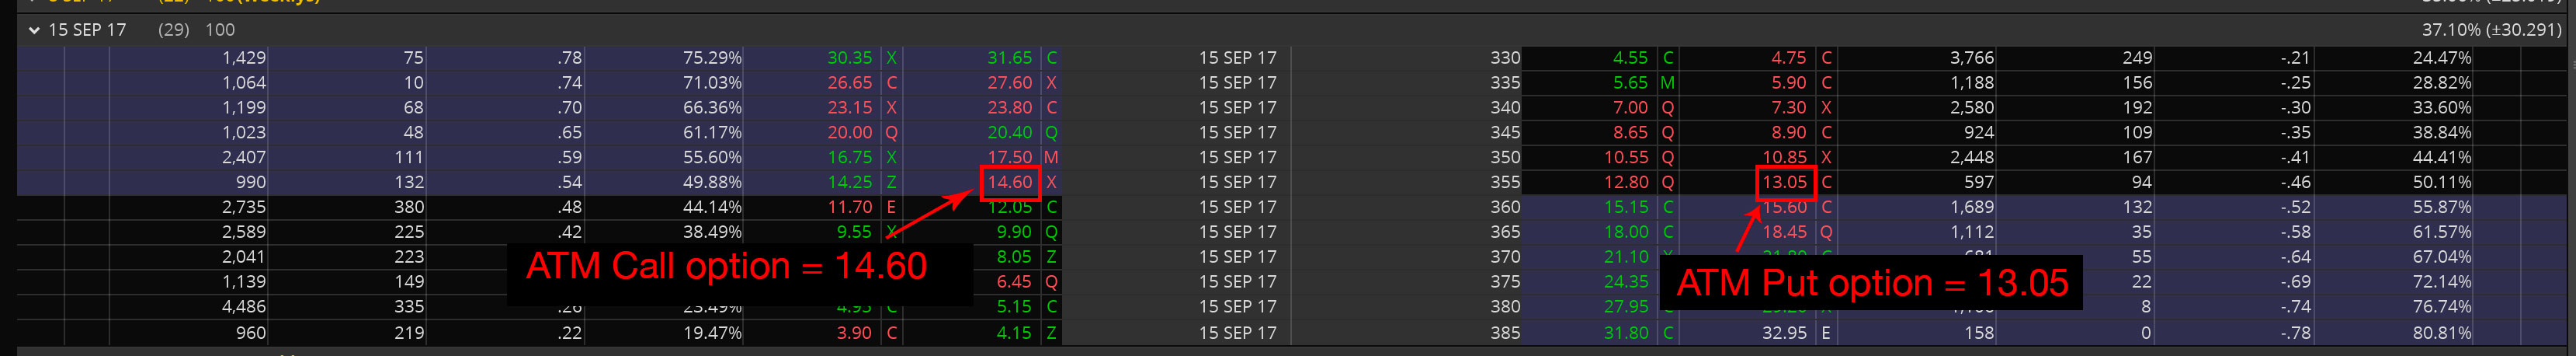
You’ll notice that the platform is showing an expected move of 30.29 while the ATM Straddle from the options chain is showing a move of 27.65. Yep. It’s not exact and it’s not perfect. These are probabilities after all. But it gives us an accurate enough estimate to give us a really good idea of the stocks expected move.
How accurate is it?
The expected move defines the range of trade for a stock within 1 standard deviation or 68% of the time. So there is a 68% chance that the stock will trade within range of the expected move. The options market is pretty sophisticated so for liquid stocks it ends up being fairly accurate. Less liquid stocks and more specifically the stocks option chain could have a much higher margin for error. I wouldn’t hesitate to use it for any widely held stock or ETF.
Determining the liquidity stock is a topic for another day but as a ballpark take a look at the the ATM options. What is the open interest? What is todays volume? Does it look thin? Or are there hundred or even thousands of open and traded contracts? This can be a first sign and quick assessment of liquidity. For an ETF like SPY which is heavily traded the expected move is quite accurate. And as a bonus the SPY now has expirations multiple times a week. Which means that you can find the expected move for the market for even finer grained periods of time.
The expected move should be a key tool in your arsenal of trading. It is probability based, easily derived and quite accurate. It can serve as a good sanity check on your market assumptions and even give clues as to hidden risk in the market. Start taking a look at expected move daily in your favorite stocks. Track it and see for yourself how it can give you that extra edge you’ve been looking for.
Join Us
Join the TradeTactix way. Nothing but high-value information with trade ideas and unique research.
We respect your privacy.
Leave a Reply