Price Action: Your Secret Weapon – Part 1

There is always one thing that you can count on in the markets. It is that price can do whatever it wants. However, it does tend to move in common patterns. Being aware of this common price action behavior can keep you on the right side of a trade and give you an insight that few traders have. Once you learn a few basics of price action it will seem almost too easy to see where the market might move.
BONUS: Free Download. Perfect your trade entries with the
5 Key Factors Impacting Support and Resistance Zone Strength.
When Is Price Action Valid?
The great thing about price action is that it applies to any individual stock, ETF, Futures contract, index, currencies or any other product. If it trades then it will exhibit the basics of price action. What’s more it also applies to any timeframe. Whether it’s a monthly chart or a 1 minute chart price action behavior is consistent.
This is great news. By mastering this one technique you can have a great insight into any market at any timeframe. This portability of price action means that you can drop into any market and immediately have an idea of what is happening with it.
The Two States Of The Market
The market tends to be in one of two states at any point in time. It is either trending or it is consolidating. That’s it.
In a trending market price is moving in one general direction in order to find a new equilibrium. A trend can be be either to the upside or to the downside and it can also be either long or it can be short. A long term uptrend is commonly known as a bull market while a long term downtrend is known as a bear market.
A consolidating market tends to move in a tight range and may move sideways. It can also move slightly up or down in a well defined channel. A consolidating market has found an equilibrium and is taking a rest until it moves on to find a new level once the dynamics of supply and demand change.
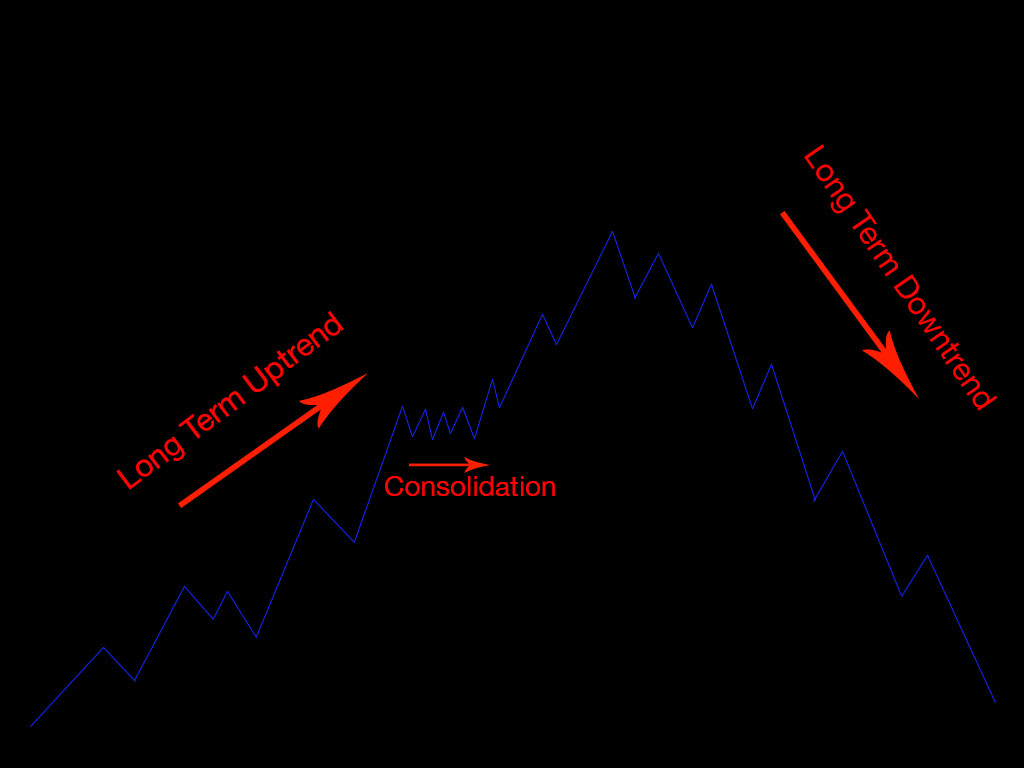
Another way to think of these two phases of trending and consolidation is one of range expansion and range contraction. Markets will go through periods of range contraction where the price stays in a narrow range or channel. Then when it has built up enough energy it will expand (trend) to a new level where it will again undergo some amount of range contraction.
Price Is Truth
Price reflects all of the technical, fundamental, emotional, global economic, and supply/demand forces present in the market. The current price is simply the correct price. It doesn’t matter what anyones opinion is on what price should be. Placing our opinions on the correctness of price clouds our vision of it and invariably places us on the wrong side of a trade. Instead price should be merely observed for what it is.
This notion that price is the embodiment of all current information in the markets is rooted in Dow theory. During the early 1900’s Charles Dow wrote a series of Wallstreet Journal articles in which he outlined his theories on the markets.
Market Structure
When looking at a stock chart you see a jagged series of data. Darting up and down in a somewhat random pattern creating peaks (highs) and valleys (lows). However, if you study a price chart carefully you will notice that an upward trending chart will generally exhibit a series of higher highs and higher lows.
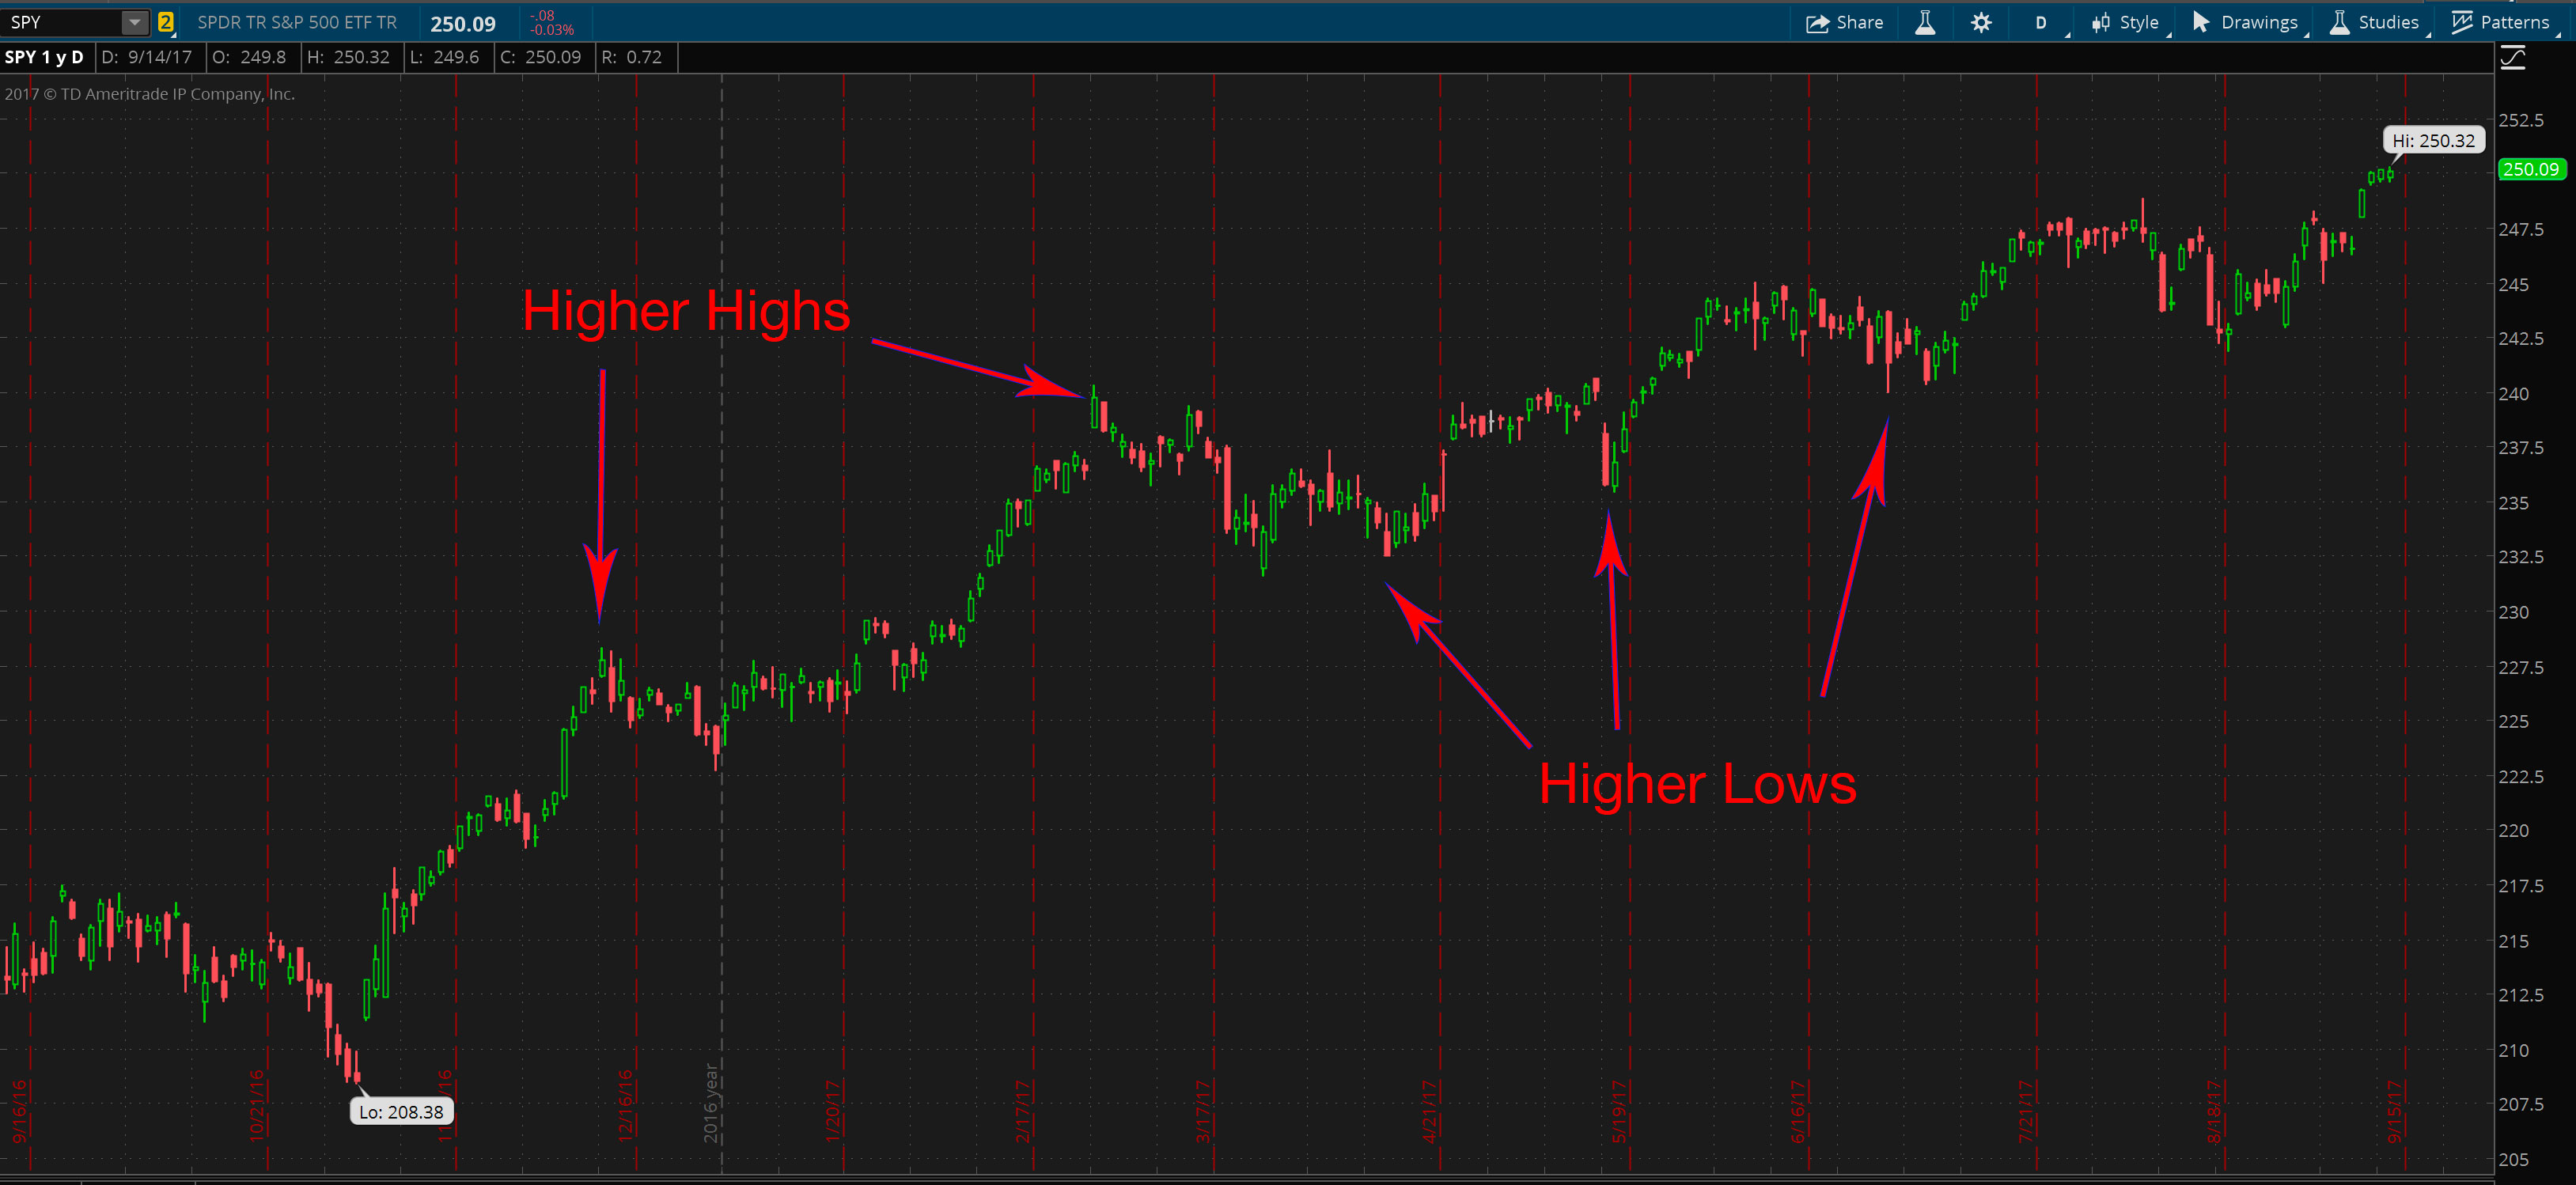
You’ll notice that in an up trend each successive peak is higher than the last. Also, each low is higher than the one that proceeded it. If you look really close into a zoomed in area you may see some lows and highs that don’t follow this behavior. These would be part of a smaller timeframe downtrend which in itself is part of the larger uptrend. But, this is a discussion for another time. For now, concentrate on the major highs and lows. The ones that really stand out with a fair amount of space before and after them.
In a downtrending market you will see a series of lower highs and lower lows.
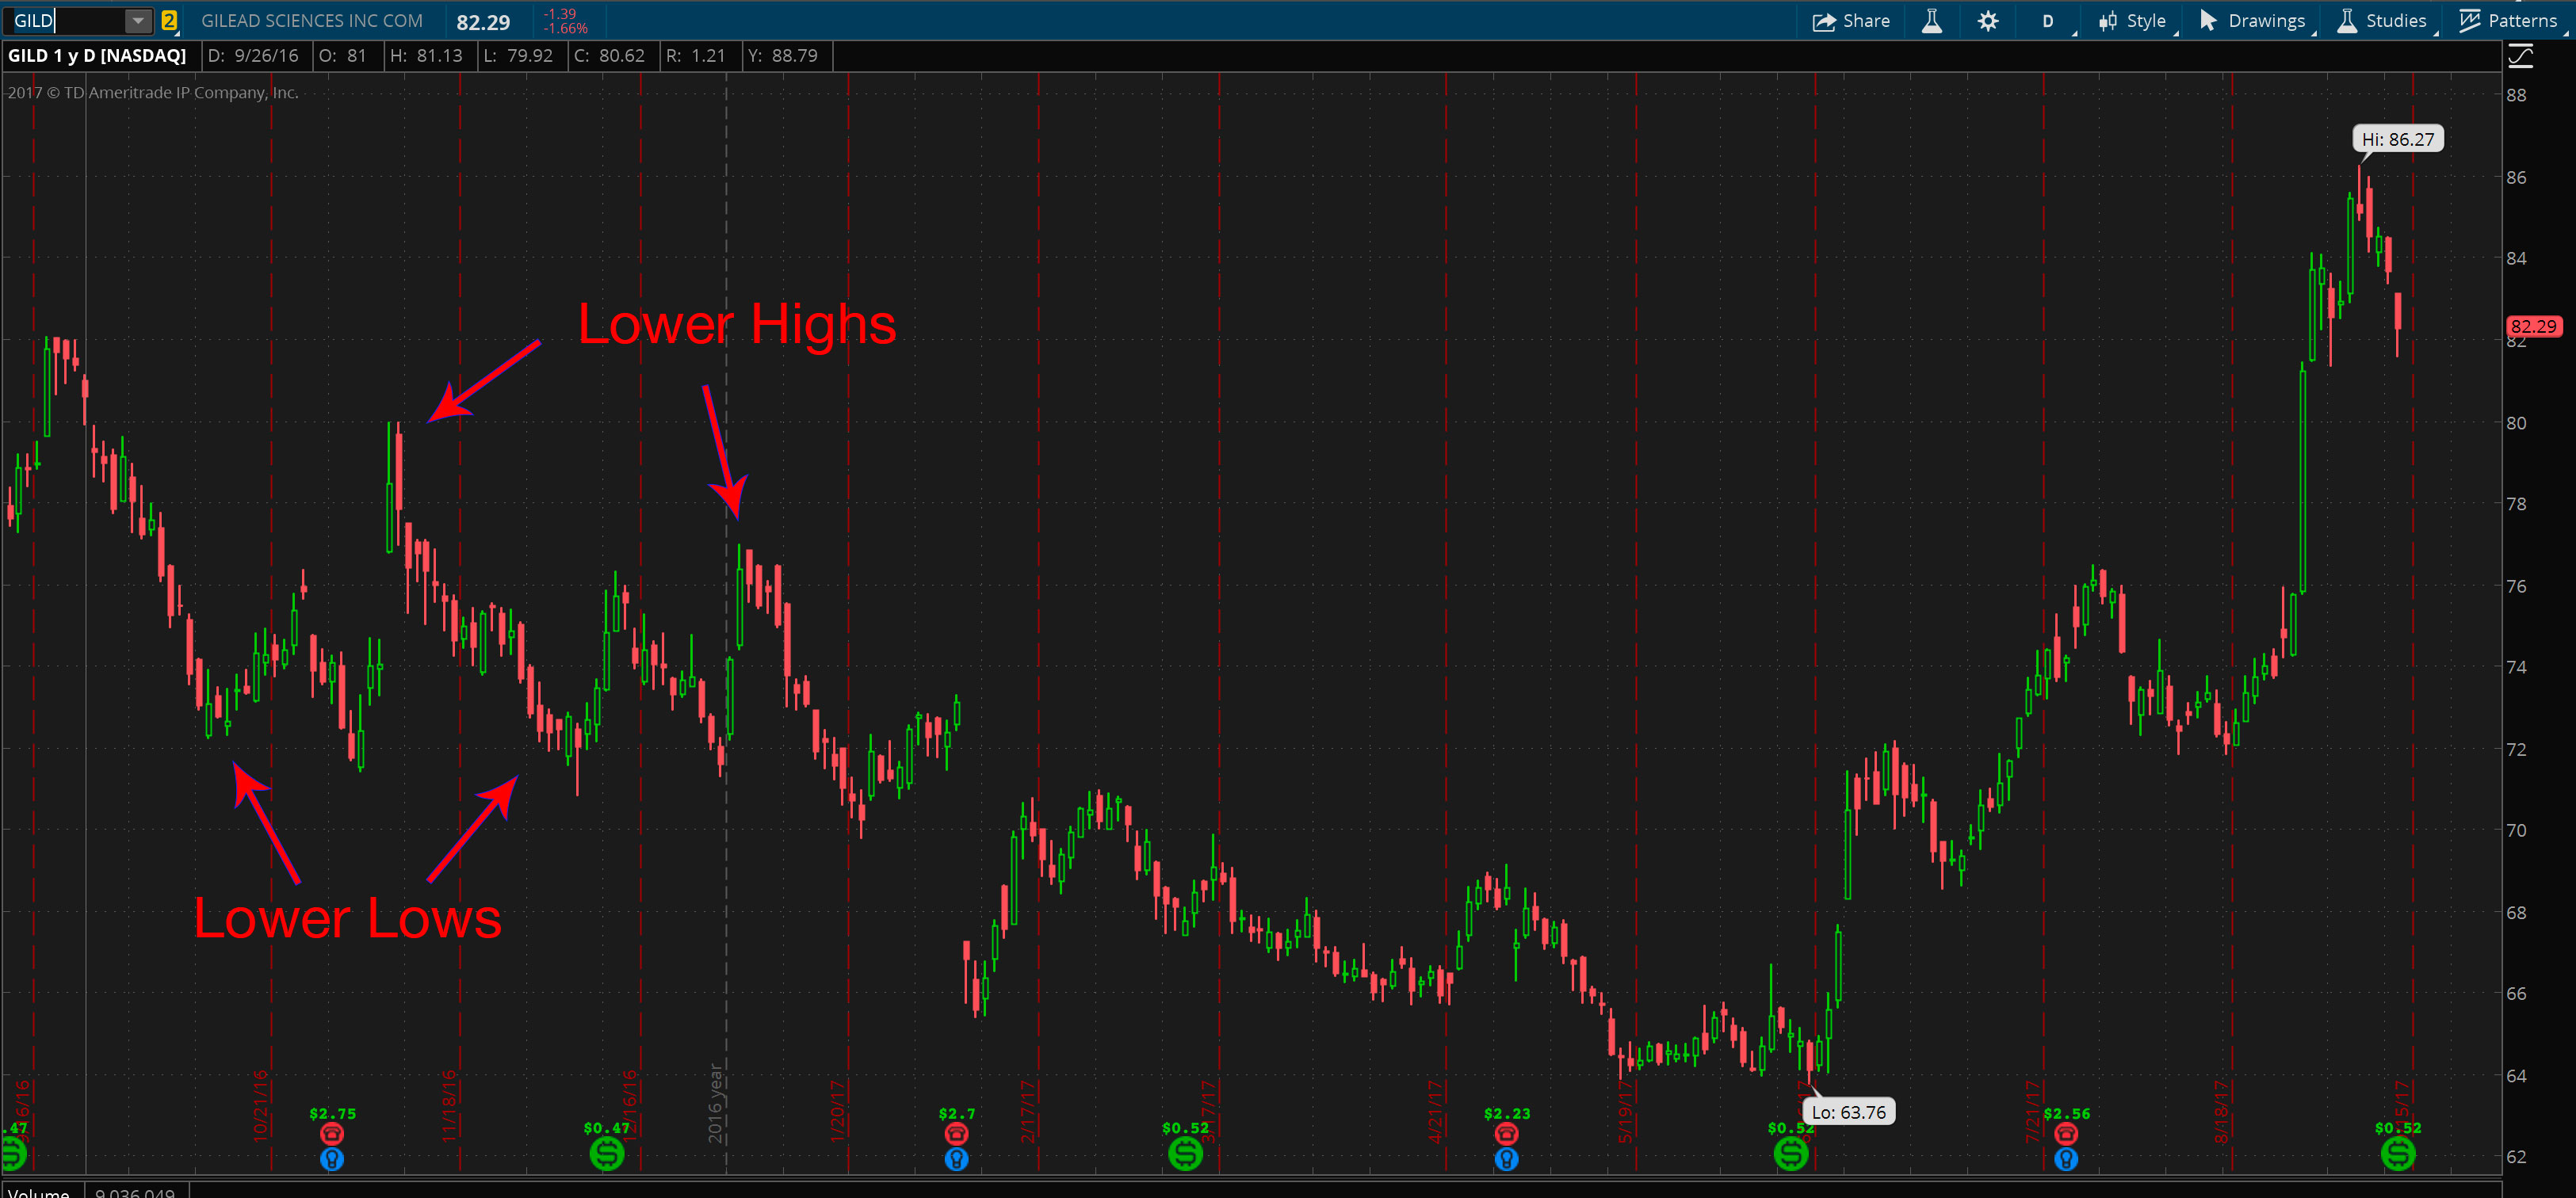
Similar to an uptrend a downtrend exhibits a consistent behavior of its highs and lows. Except in this case each low falls to a lower level than the one before it and each high reaches a lower peak. The goes on until the trend breaks.
BONUS: Free Download. Perfect your trade entries with the
5 Key Factors Impacting Support and Resistance Zone Strength.
Finally, in a consolidating market you will see price moving sideways within a range. You may also see it move slightly up or slightly down in a channel. This range bound behavior typically follows an uptrend or a downtrend. In these zones the market is trying to find some equilibrium so it goes through a period of range contraction where it doesn’t really move significantly higher or lower.
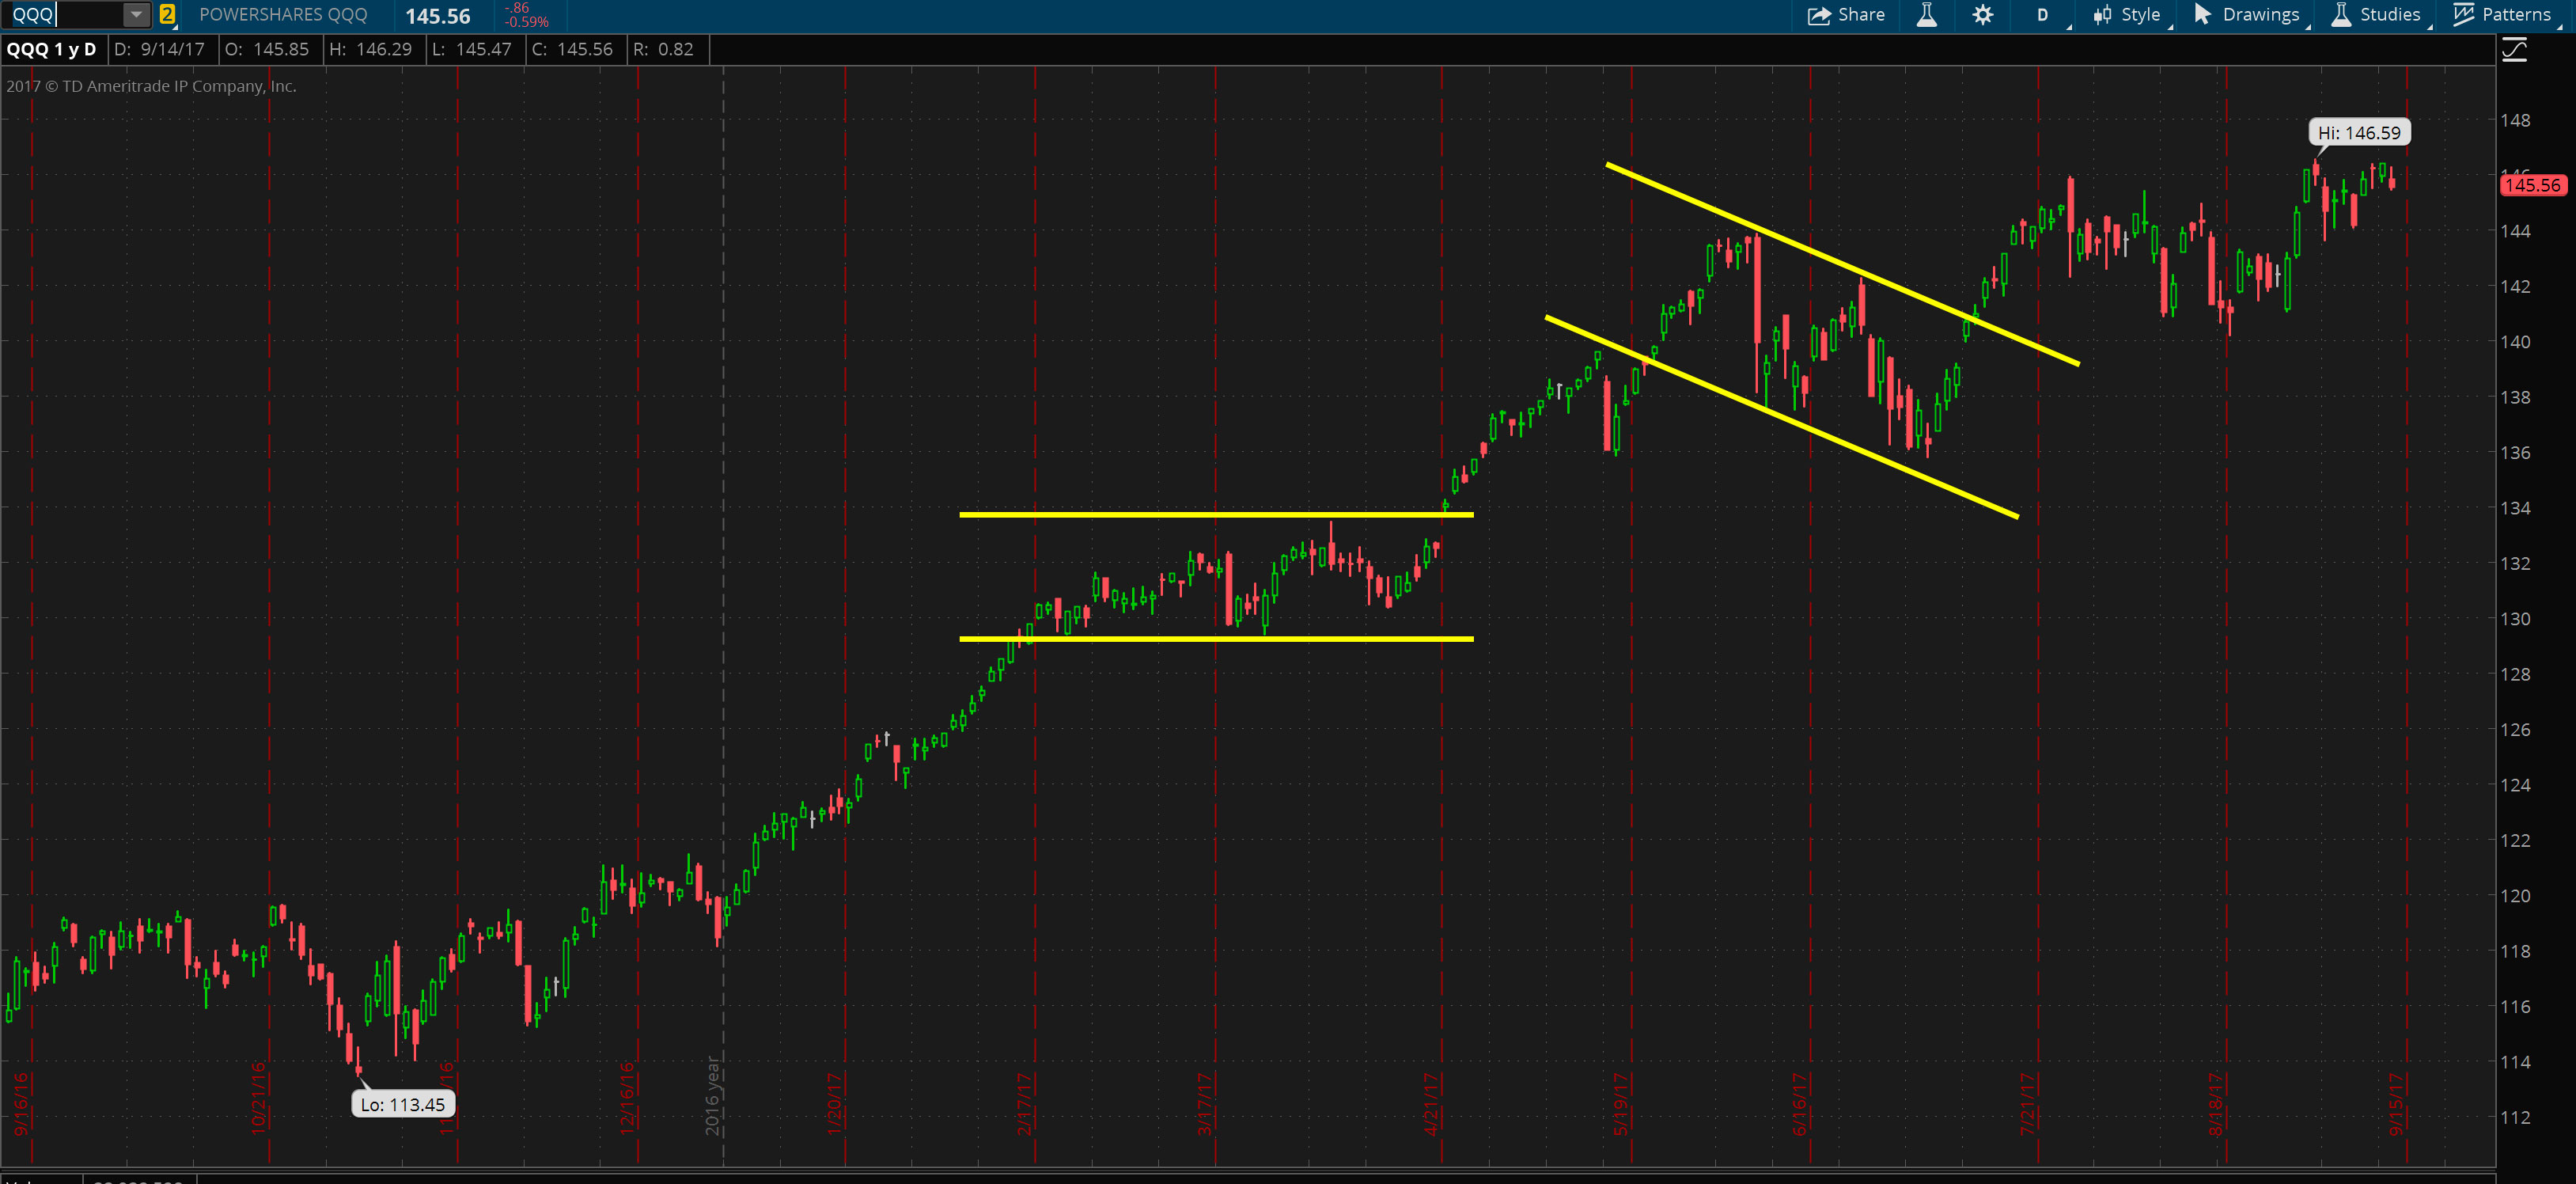
Armed with just this basic knowledge you can begin to get a feeling for the market. When you look at a stock chart or watch price unfold live keep these basic ideas in mind. Watch for higher highs in an upward trending market. Or look for price consolidating in a range or channel. Once you start to recognize these market structures you will see them everywhere.
However, there is more to add to these powerful concepts. In part 2 I’ll talk about support and resistance levels, breakouts, and how to identify trend changes.
Join Us
Join the TradeTactix way. Nothing but high-value information with trade ideas and unique research.
We respect your privacy.
Leave a Reply