Price Action: Your Secret Weapon – Part 3

In this part 3 of our series on price action, we look at breakouts. If you haven’t reviewed Part 1 and Part 2 yet I highly suggest doing so. These concepts build on each other and will lead to an intuitive understanding of price action.
Energy Build Up
Markets move through phases of contraction and expansion of price. During a contraction phase, the “energy” of the market builds up like a coiled spring ready unleash its potential energy. As we discussed in Part 1 and Part 2 this contraction in price or consolidation occurs the majority of the time. Price seeks the current value and only when that value is perceived to have changed does it move to a new level. It is this move to a new level or “breakout” that can have a huge potential reward to the trader.
BONUS: Free Download. Supercharge your price action analysis with the
5 Key Factors Impacting Support and Resistance Zone Strength.
We never know for sure when a breakout will occur but we can identify when they become more likely. Look for consolidation. A consolidating market will expand its price range to a new zone eventually.
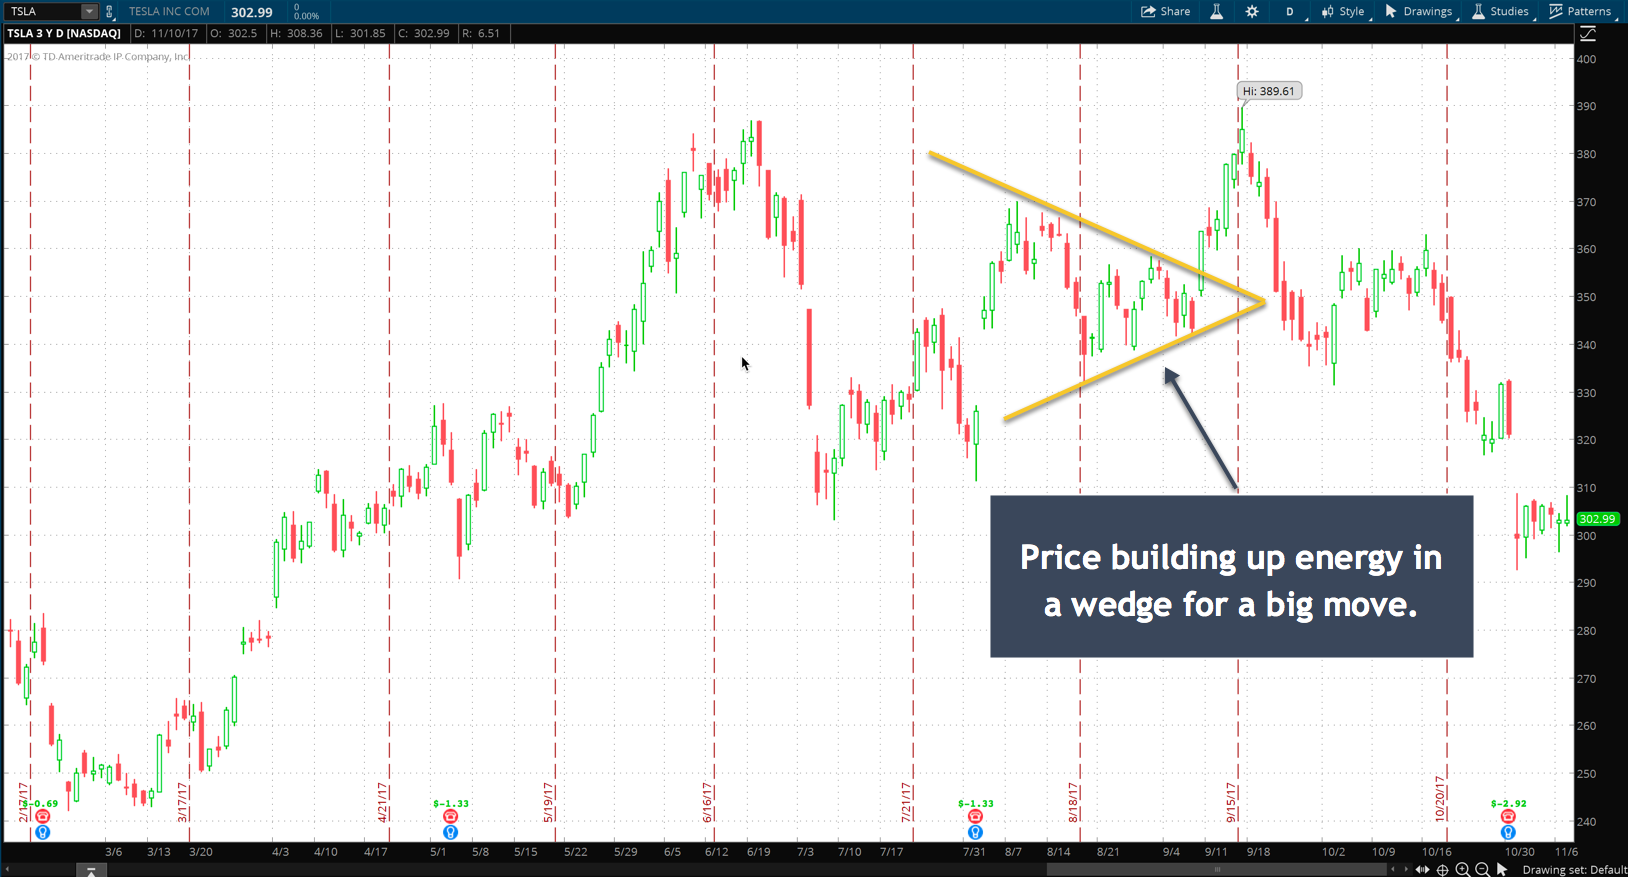
A consolidating market gives clues as to the strength of its impending breakout. Like a spring being coiled tighter and tighter a market that is trading in a narrowing range is building up energy for a big move. The tighter the range and the longer that it lasts the bigger the potential impending breakout move.
The Breakout
There are several price patterns that we can look for that indicate a consolidating market.
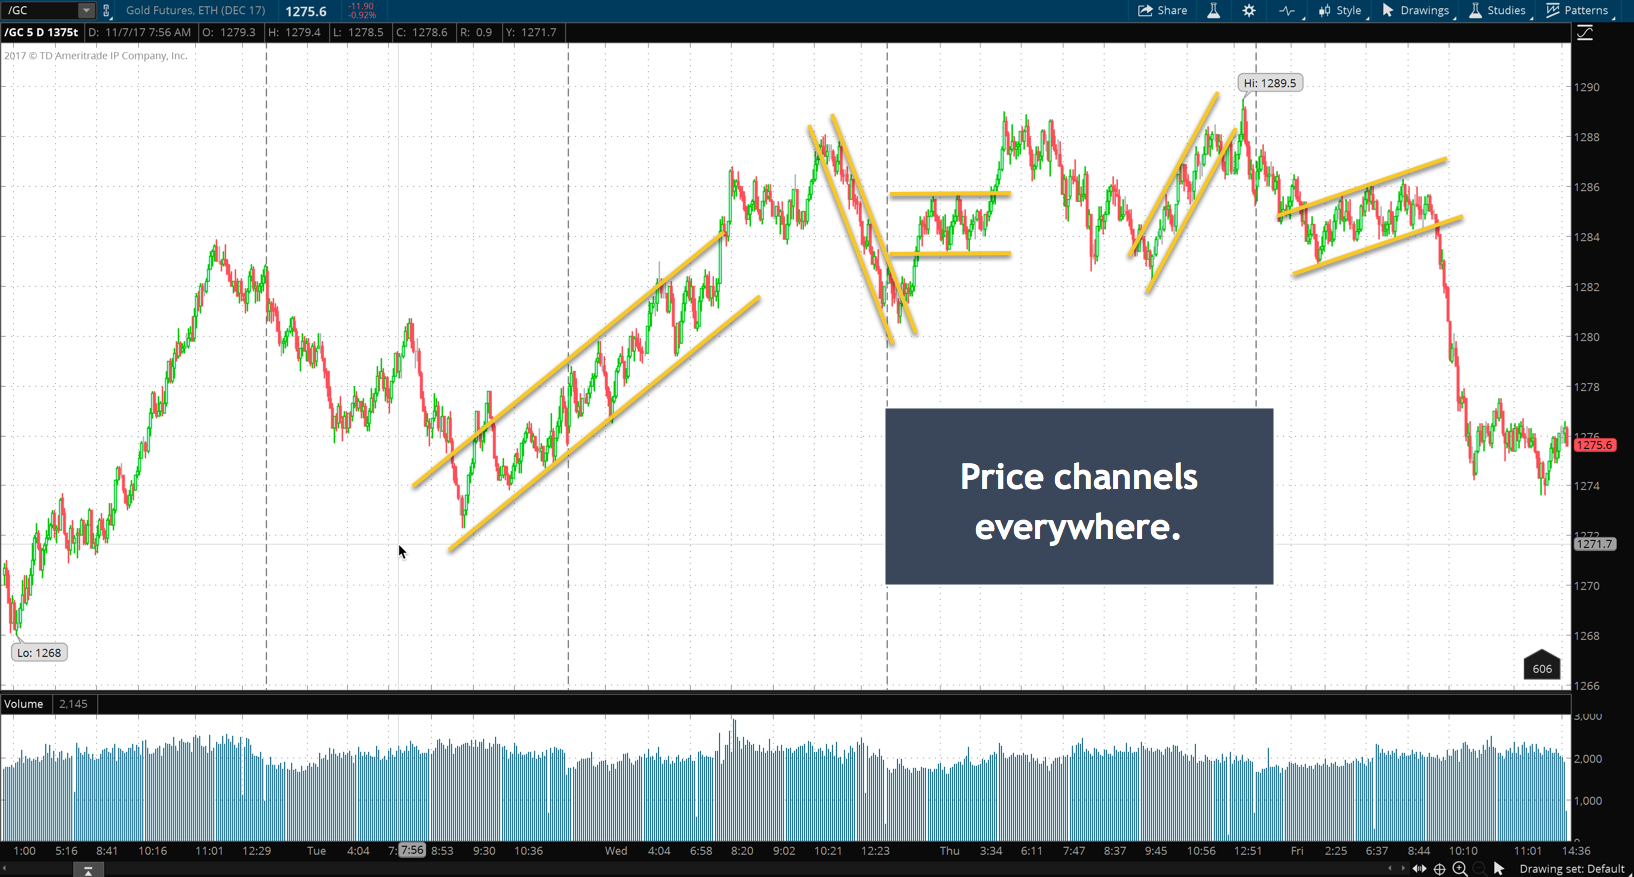
First, we can look for price trading in a channel. This channel can be horizontal or sloped upwards or downwards. Whichever direction the price channel may be angling it is defined by at least two highs and two lows. Trend lines can be drawn across the highs and then across the lows in order to visually see the channel in action. Often price will test the upper or lower bounds of the channel many times before breaking out.
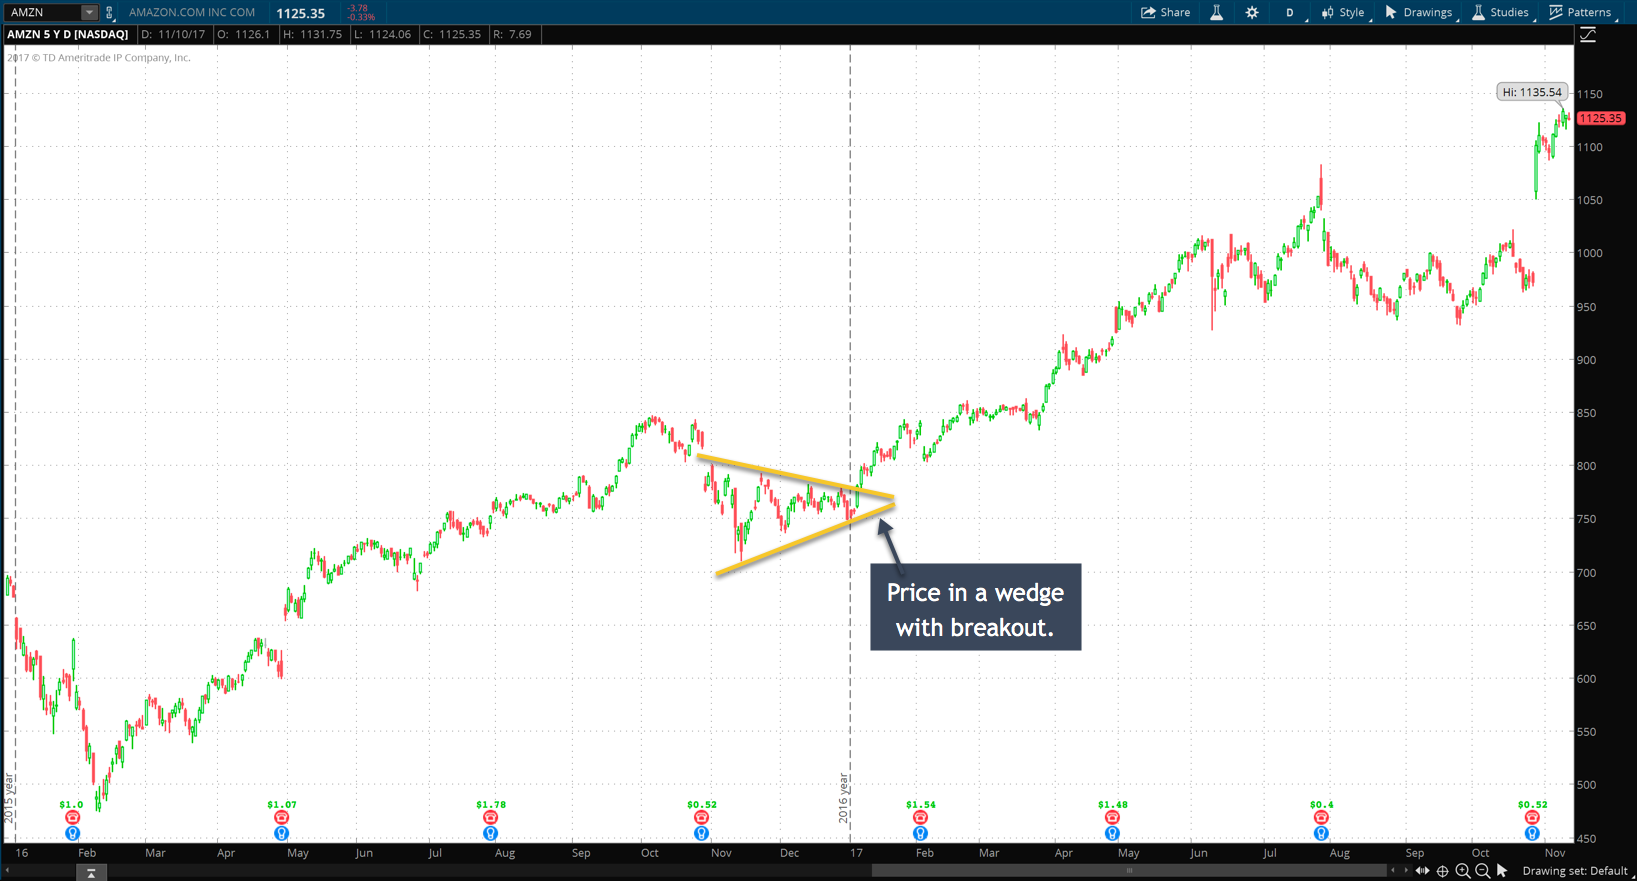
Next, we can look for price trading in a wedge or triangle like shape. Like the price channel, this pattern could be horizontal or angled upwards or downwards. But, the clear pattern is one of price trading in an ever-narrowing range. This relatively common pattern is very powerful as it portends a market that is building up for a big move. A trend line can be drawn across the highs and lows of the pattern that will eventually converge and cross each other. The more that price works itself into the vertex the tighter and more coiled it becomes. Often this vertex or crossing of the trend lines will coincide with a support or resistance level. This can be a very powerful market structure. Unlike the channel which is open-ended, the triangle or wedge pattern can give you some sense as to when a breakout might occur. Rarely does price just dribble out the vertex of the triangle. More often than not it will work itself into a tight zone and breakout with a big move before it reaches the narrowest part of the triangle. You can use this characteristic to be on high alert for a potential breakout.
One maxim to remember is: “Rising patterns break to the downside and Descending patterns break to the upside”. This makes intuitive sense if you think about it since a pattern really won’t continue rising or falling forever. Hence it will eventually break in the opposite direction as is the nature of price.
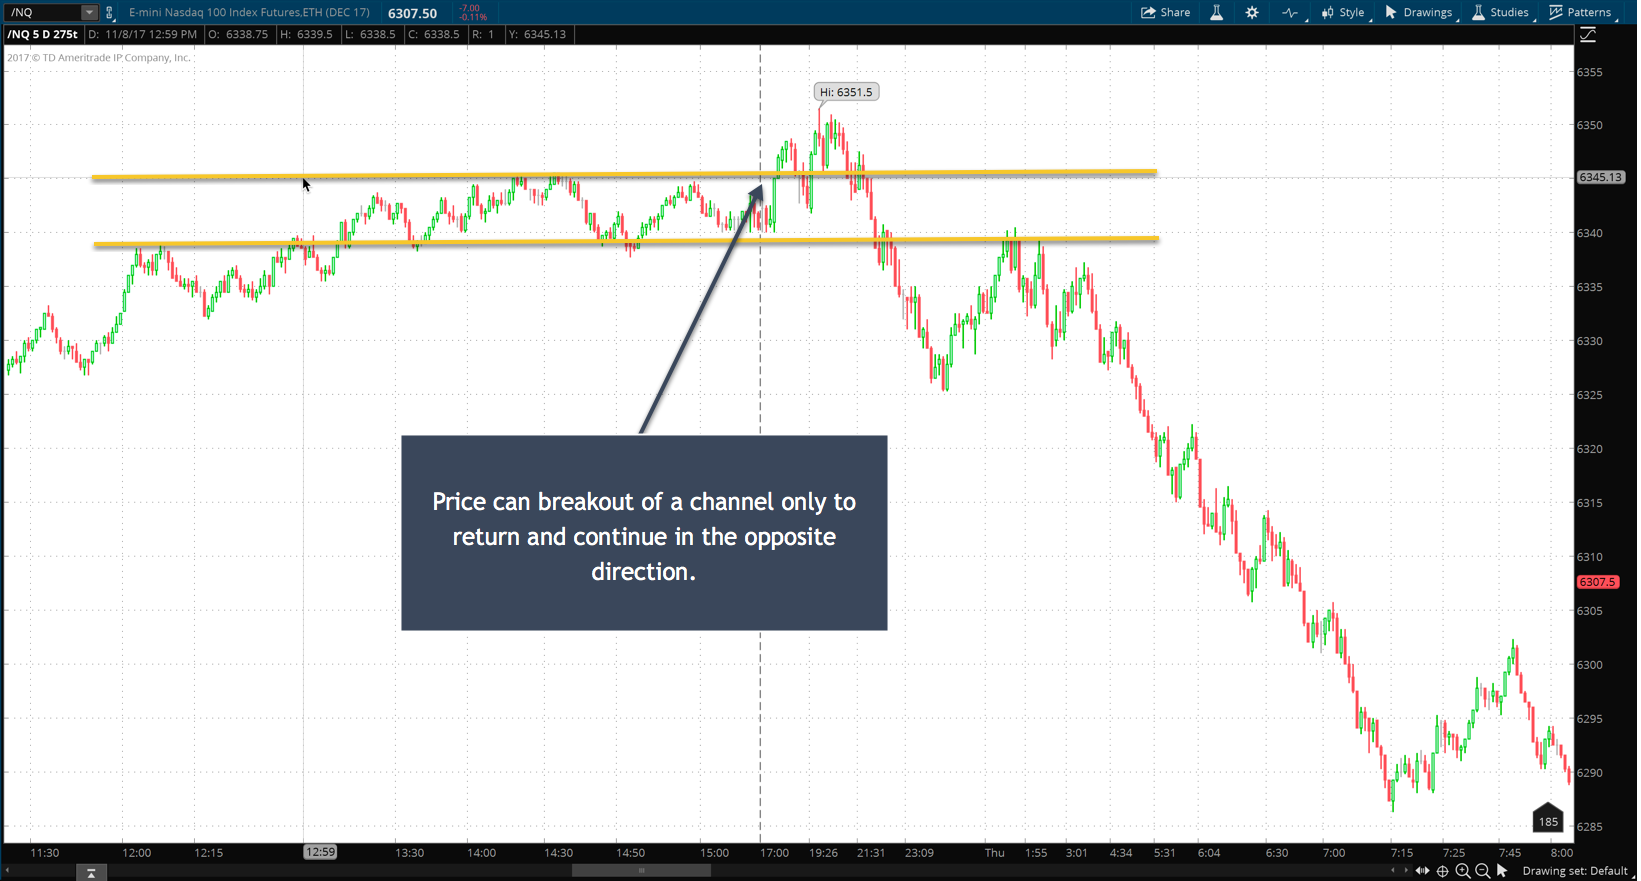
When price begins to approach an upper or lower bound of a price channel look for a breakout. Price will pierce that channel line extend beyond it in an obvious break of the channel. Often times price will fall back to the channel line in order to retest the level and then reverse and continue on in the direction of the breakout. This retest may give you a second chance opportunity to enter a trade. But beware in the case of a rising or falling channel this retest level may be on the other side of your trade entry should you have entered a trade on the original breakout.
BONUS: Free Download. Supercharge your price action analysis with the
5 Key Factors Impacting Support and Resistance Zone Strength.
False Breakouts
Looking for breakouts for trading opportunities can be very rewarding. However, watch out for the false breakout. Often price will extend below a consolidation only to reverse back through the consolidation zone to breakout on the other side. This whipsaw action can wreak havoc on your trading account not to mention your emotional state.
This often occurs on rising channels. Price will breakout above the channel in a parabolic move and then quickly turn down only to break out at the bottom of the channel and keep dropping. This move can catch the unaware trader off guard and on the wrong side of price action. Remember, “Rising patterns break to the downside”. So if you see price break above a rising channel in a parabolic move then keep your cool and watch for price to turn down through the channel again.
This concludes our short series on price action. Just these simple basics of watching price behavior can benefit your trading enormously. If you have any comments on additional price action behavior or if you’d like for me to cover another topic please leave a comment below.
Join Us
Join the TradeTactix way. Nothing but high-value information with trade ideas and unique research.
We respect your privacy.
Great Description through Charts. Thanks for describing like this.