Price Action: Your Secret Weapon – Part 2

In Part 1 of this series, we discussed the two primary states of the market, the truth of price, and basic market structure. If you haven’t reviewed part 1 yet I highly suggest doing so. These concepts build on each other and will lead to an intuitive understanding of price action.
Value Zones
The market moves in waves. A push forward followed by a pullback. The old “two steps forward, one step back” adage holds true here. The primary motive of price is to seek value and this is seen as an ebb and flow.
BONUS: Free Download. Perfect your trade entries with the
5 Key Factors Impacting Support and Resistance Zone Strength.
When seen visually via a stock price chart this value-seeking behavior becomes the semi-random movement that we’re familiar with. Price will move within a range, or zone until market conditions change and the current value is seen as too expensive or overly cheap. At this point, price will move to a new value zone and operate there until conditions change again. This can be thought of as range expansion followed by range contraction.
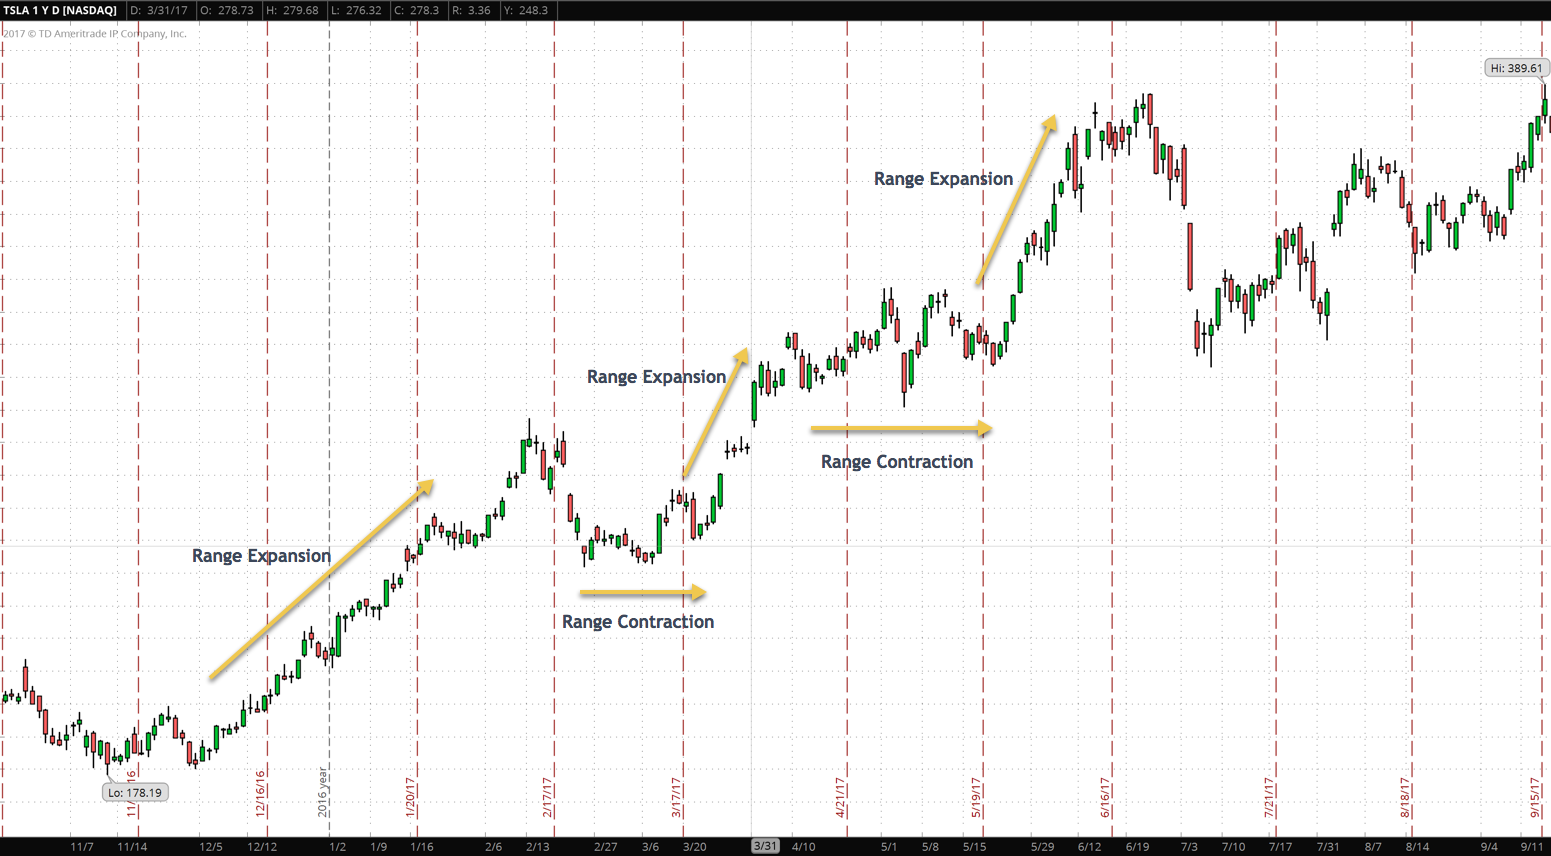
Often price will stay within a value zone for an extended period of time. At other times it will only stay briefly before seeking a new area. Likewise, range expansion can be either brief in nature or an extended move. You might know range expansion as a “trend” and range contraction as “chop”.
Energy
For the majority of the time price trades in a value zone while it is undergoing range contraction. Then when conditions change it expands its range in a brief burst as it seeks a new value zone through range expansion. A good way to think of range expansion is the release of stored energy.
As price contracts, it is building up a potential energy to move. The longer it contracts and the tighter price coils up during that contraction phase the more energy it is building for a move. When the energy is released it results in a range expansion. More stored energy results in a more expanded range seen as a larger trending move. Once the price energy is released the range expansion slows and eventually halts in a newly found value zone. Price will then consolidate, or contract, as it builds up more energy again. Range expansion followed by range contraction followed again by range expansion. This is the market cycle and it continues forever.
Market Structure
As price moves forward in time it leaves a history of where it has been. This price history is what you see when looking at a chart. Areas of range contraction followed by range expansions. Price can be thought of as having a memory as it will recognize and react to these past areas as it moves forward in time.
These past zones of price action create a market structure that supports and resists price. It is this market structure of past price behavior that can leave clues as to the future behavior of price. And learning to read market structure and anticipate how it will impact future price can give you a tremendous edge in trading. It is, however, more of an art than a science. Fortunately, certain rules do apply which gives us some basis upon which to make decisions and base our interpretations. It is how we interpret market structure that becomes the art of reading price action.
Support and Resistance
Areas of range contraction create zones of support and resistance for future price behavior. Many traders will pick out an exact high or low price and label this price as support or resistance. While there is some merit in this, in general, it is incorrect to think in these absolute terms. Instead, support and resistance should be thought of as zones or areas that price tends to consolidate in.

Support is a price zone that tends to hold price up. It sits below price and provides support to the market. As price trades down to an area of support, it will tend to stall. When approaching a zone of support price may tend to trade just above it. At this point, it may reverse direction or it could punch through support seeking lower levels. The faster and stronger a move down into support the more likely price is to punch through it.
Resistance is the exact opposite of support. It sits above price and acts as a barrier to the market. As price trades up into an area of resistance, it will also tend to stall just below the zone. At this point, price may reverse direction or continue on breaking through the resistance to higher levels. As in support the faster and stronger the move into resistance the more likely price is to break through.
When price does break through a resistance level to higher levels the old resistance zone turns into a supporting price zone. Price will now tend to stall at this level when approaching from above. The same happens when price breaks support to new lower levels. When was once support becomes resistance as price moves below the support zone. Support becomes resistance and resistance becomes support.
BONUS: Free Download. Supercharge your price action analysis with the
5 Key Factors Impacting Support and Resistance Zone Strength.
When price tests a support or resistance zone it will often stall and even reverse. There are many factors which determine the validity or strength of the support or resistance zone. One of these is the number of times that the zone has been tested. A zone is more likely to hold on a first or second test of the area by price. A third or fourth test is far less likely to hold price in. For each subsequent test of the zone the probability that price will break through increases. A great way to remember this behavior is the old adage, “Persistence beats resistance”. Persistent tests of a resistance zone will eventually beat it. Obviously the same holds true for support.
Support and resistance zones are just one aspect of price. They can be used to time entries, exits, and to find suitable areas to place stop orders. However, you should always be aware that professional market participants are also very aware of these zones and may act to take out stop orders placed just above or below support and resistance zones. In any case, these dynamic price levels are very important and play a critical role in the behavior of price. Look for them and study price behavior around these areas. You will start to see common price action and patterns which can give you an edge in trading.
In Part 3 of this price action series, we’ll look at breakouts. You don’t want to miss this one so be sure to subscribe to our email updates so that you can be notified as soon as it’s available!
Join Us
Join the TradeTactix way. Nothing but high-value information with trade ideas and unique research.
We respect your privacy.
Leave a Reply